
Hey! I'm (randomly) walking here

The quintessential example used to explain random walks is to imagine a drunk person stumbling around. To make it simple, they’ll randomly move either to the left or the right. Let’s visualize what this might look like.

Since they’ll take random steps, we can multiple simulations of where they might end up after 10 steps. We can extrapolate this further over time to get the following
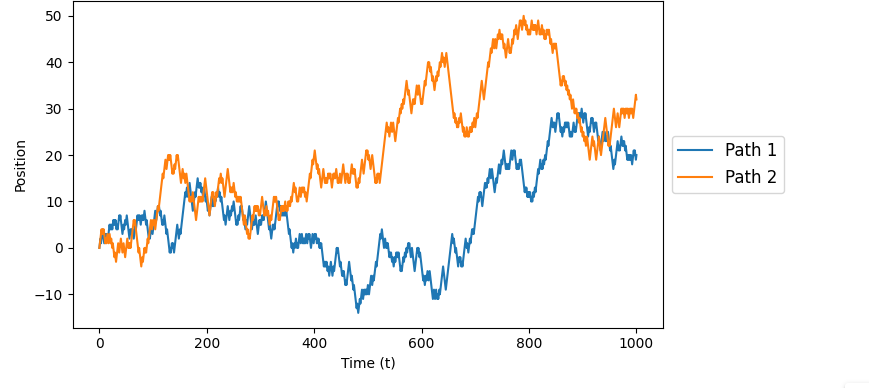
This isn’t telling us much. We just have a person just stumbling around and we’re just guesttimating their position. However, the key idea is that each step is independent. The step the person at step 100 is irrelevant to any position or step they made prior to to that. Hence the randomness. We can draw a parallel to modeling stock prices, where the stock price of tomorrow is independent of the stock price today. It’s just randomness that impacts the price.
Statistical Properties

We can model a random walk with above, where the position at some time t is just the previous step with some white noise. Now since the expectation is a linear operator, the expectation of a random walk is just the initial position. Meaning if we were to ask on average, where do we expect the drunk person to be, it would be their starting point. We can observe this as when we plot over time, the expectation just back to 0.
Likewise, if we take the variance, the variance is proportional to the square root of the number of steps.

Mirroring Stock Prices
Now this is simply a rudimentary example to demonstrate how this works. Suppose we have a stock priced at $100 and want to predict how the price is going to be. We’re not psychic, but using this random walk model, we can simulate the path of the prices it’s going to be in the future. We can do this a bunch of time which can help us give us a range of where we expect the prices to be . Assuming we have daily returns from a normal distrubtion with mu=0, and sigma=2%, we can get the following simulations.
