Intro to Pairs Trading

Some stocks move together. Coca-Cola and Pepsi. Visa and Mastercard. ExxonMobil and Chevron. They’re in the same industry, face the same market conditions, and tend to rise and fall in tandem.
But sometimes they diverge. One gets ahead of the other. And when that happens, they usually snap back together.
Pairs trading exploits this. When two related stocks drift apart, you bet they’ll converge again. You short the one that got too expensive and buy the one that got too cheap. When they meet in the middle, you profit from both sides.
The strategy has been around since the 1980s, pioneered by quants at Morgan Stanley. It still works today, though the easy pairs have been arbitraged away. Finding good pairs requires some statistical machinery. That’s what this post is about.
Stationarity: The Foundation
Before we can trade pairs, we need to understand stationarity.
A stationary time series has a constant mean. It doesn’t drift up or down over time. When it deviates from the mean, it reverts back.
Stock prices are not stationary. Apple went from $1 to $200 over the decades. It doesn’t revert to any fixed level.
Stock returns are roughly stationary. They bounce around zero. Big up days are followed by normal days. Big down days are followed by normal days. Returns don’t trend forever in one direction.
If something is stationary, we can predict it will return to its mean. That’s a tradeable pattern. If something is not stationary, it can drift forever. No edge there.
We test for stationarity using the Augmented Dickey-Fuller (ADF) test. It gives us a p-value:
- p-value < 0.05: The series IS stationary
- p-value > 0.05: The series is NOT stationary
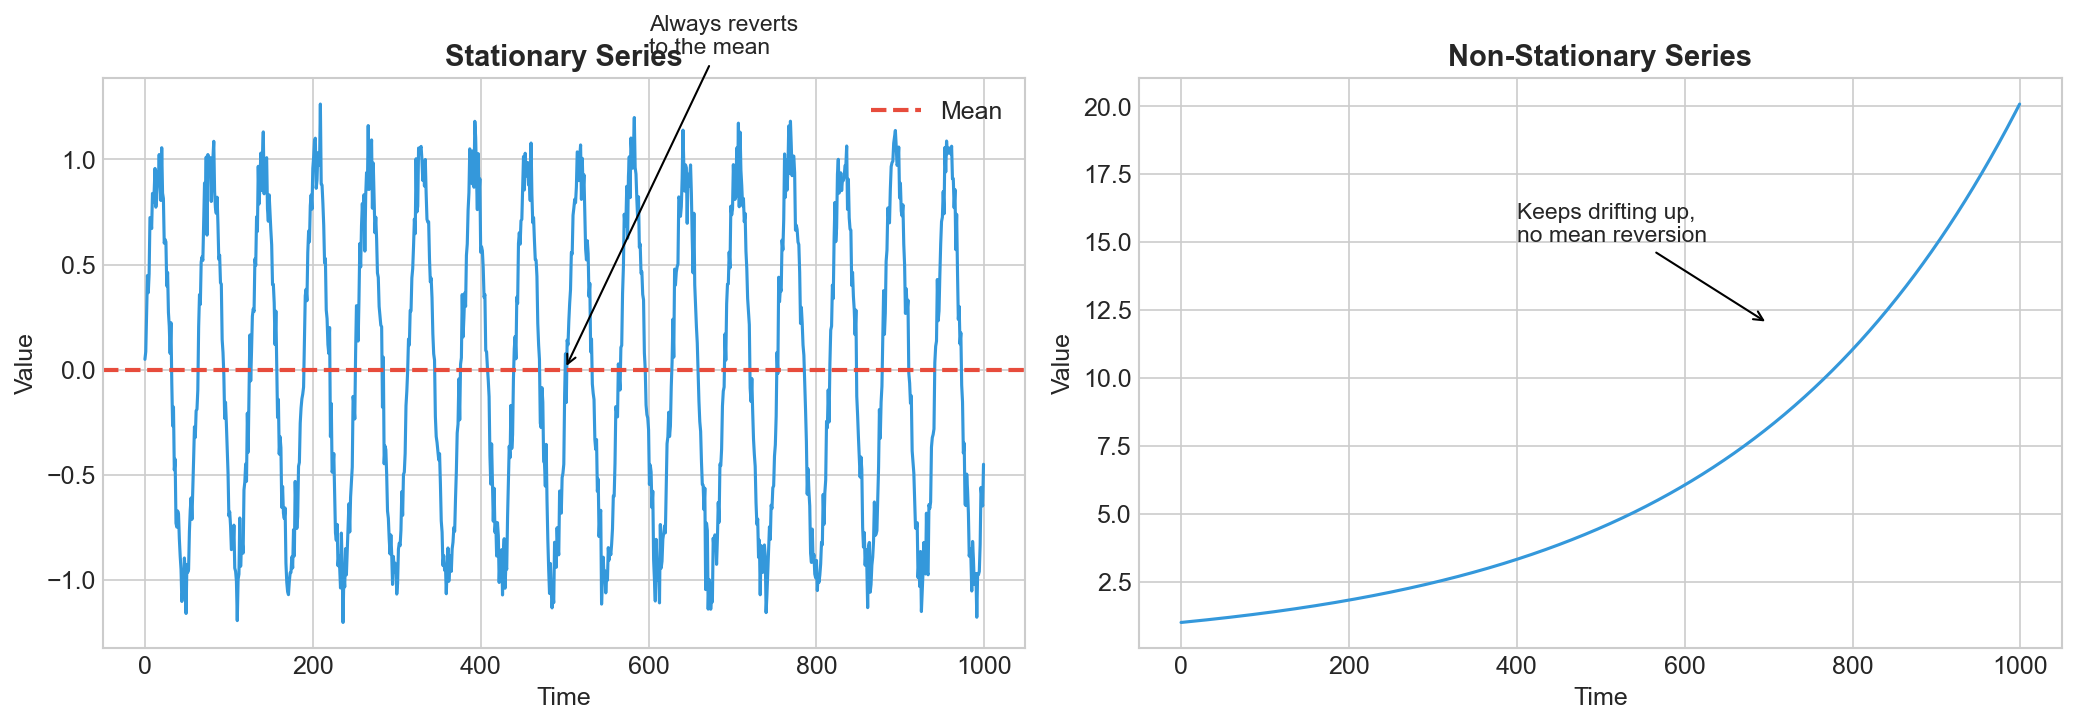
The left chart oscillates around zero. It’s stationary. The right chart trends upward forever. It’s not stationary.
Cointegration: Finding Pairs That Move Together
Two stocks can be correlated but not cointegrated. Correlation means they move in the same direction. Cointegration means they stay close together.
Example: Two stocks both trend upward (correlated). But one grows 20% per year and the other grows 10% per year. The gap between them keeps widening. They’re correlated, but not cointegrated. You can’t trade that divergence because it never reverts.
Two stocks are cointegrated when:
1. Each stock individually is not stationary (they both trend)
2. But their difference (the spread) IS stationary
Think of two drunk friends walking home. Each one staggers randomly. Their individual paths are unpredictable. But they’re holding onto each other, so they can never get too far apart. The distance between them stays bounded.
That’s cointegration. Each series wanders, but the spread between them reverts to a mean.
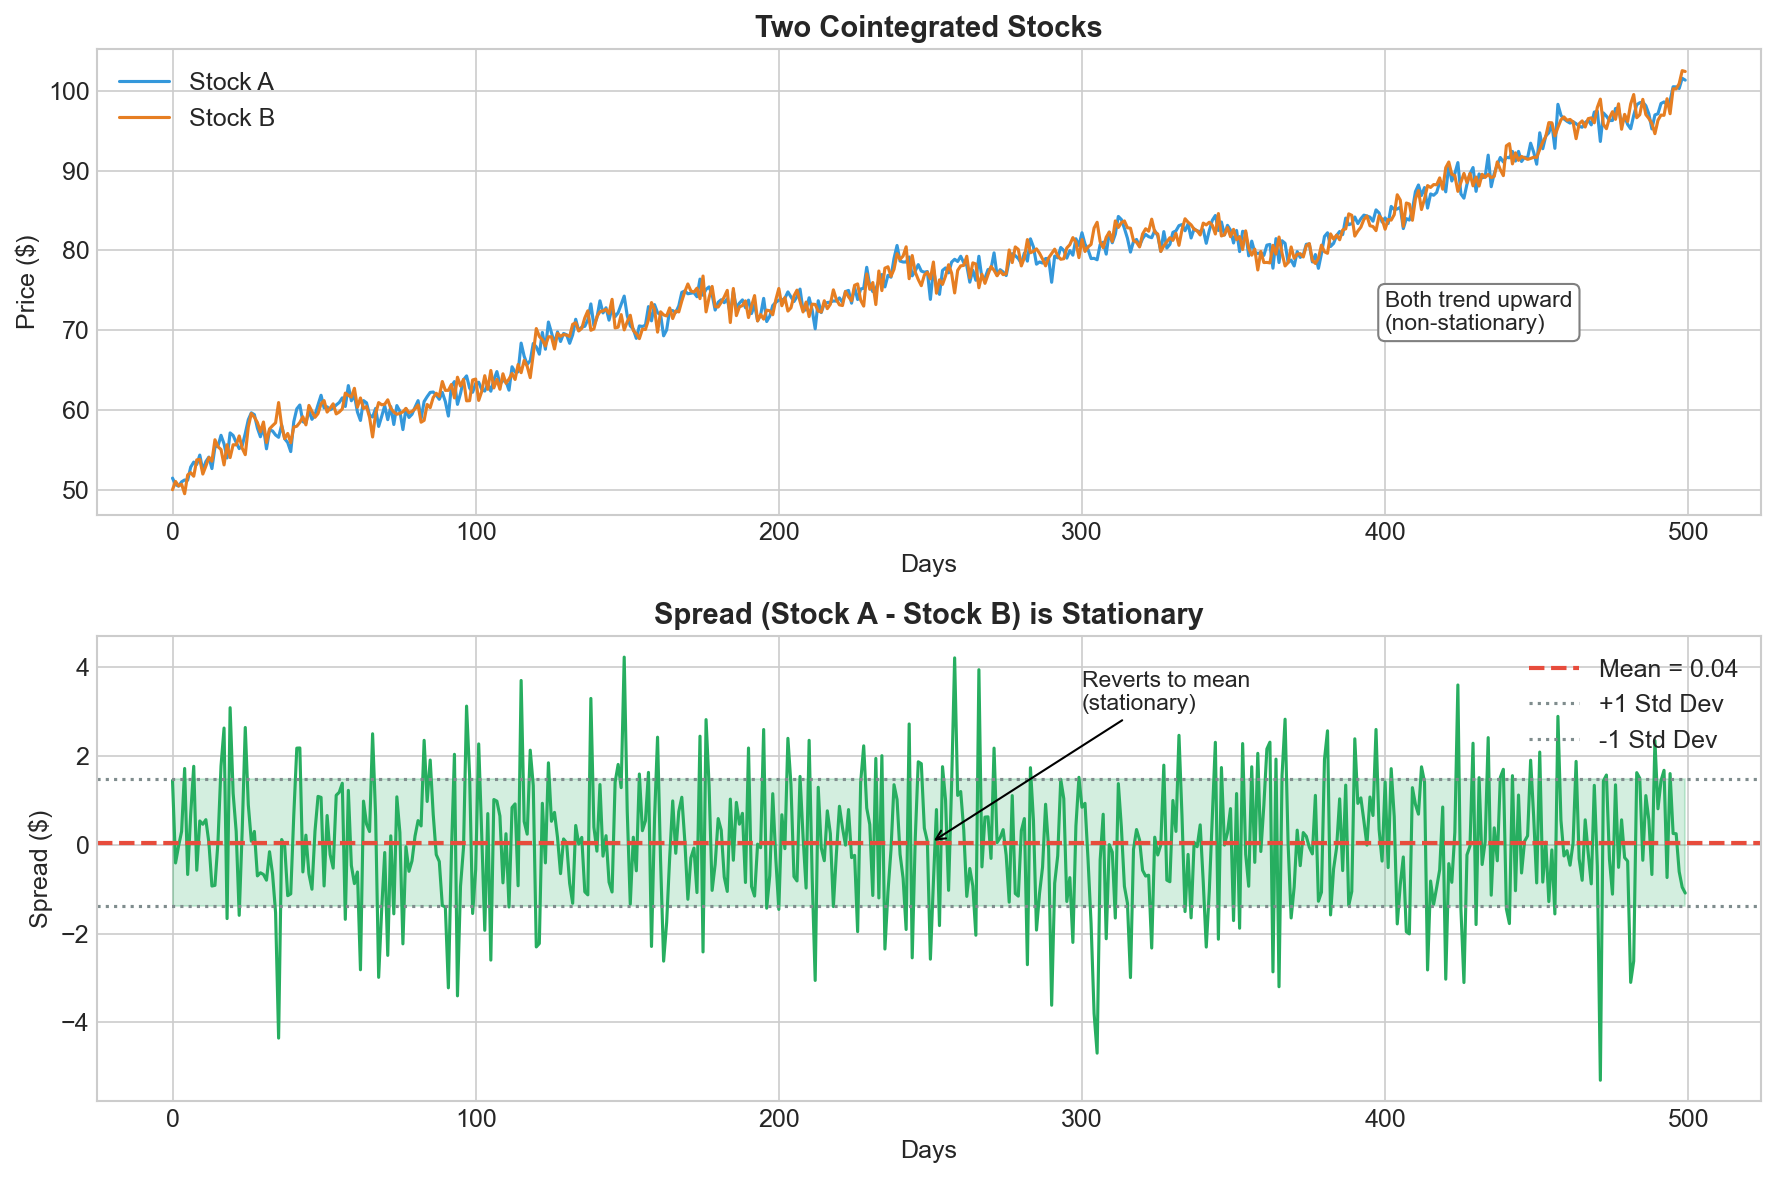
The top chart shows two stocks that both trend upward. Neither is stationary on its own.
The bottom chart shows their spread. It bounces around a stable mean. The spread IS stationary. This pair is cointegrated.
The Trading Logic
If the spread is stationary, we can trade its mean reversion.
We measure how far the spread has deviated using the z-score:
Z-Score = (Spread - Mean) / Standard Deviation
A z-score of +2 means the spread is 2 standard deviations above its mean. Stock A is expensive relative to Stock B.
A z-score of -2 means the spread is 2 standard deviations below its mean. Stock A is cheap relative to Stock B.
The trading rules:
When z-score crosses above +1 (spread too high):
- Short Stock A (sell, expecting it to fall)
- Long Stock B (buy, expecting it to rise)
- The spread should compress
When z-score crosses below -1 (spread too low):
- Long Stock A (buy, expecting it to rise)
- Short Stock B (sell, expecting it to fall)
- The spread should expand back to normal
When z-score crosses below zero:
- Close all positions
- The spread has reverted to its mean
- Trade complete
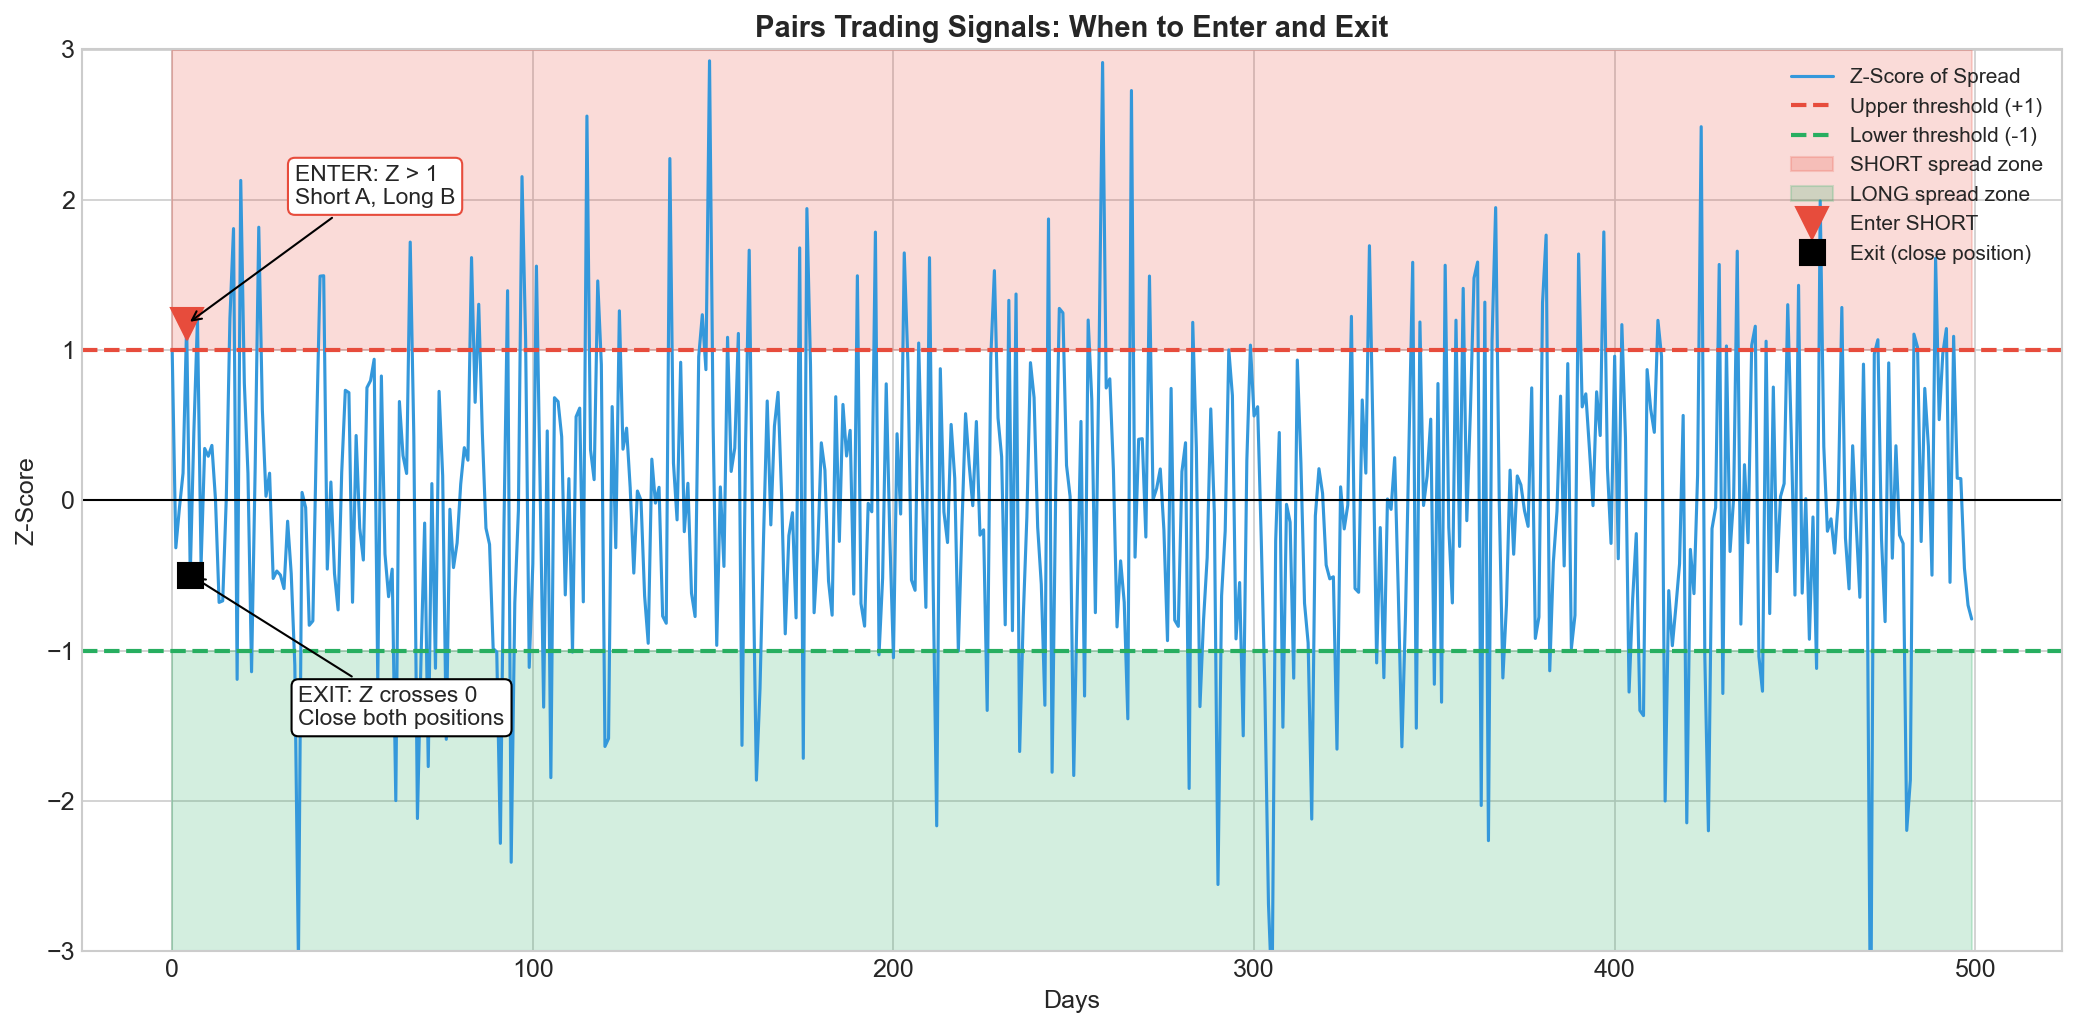
[INSERT IMAGE: images/trading_signals.png]
The blue line is the z-score of the spread. The red and green zones show when we enter trades. We enter when z crosses the thresholds. We exit when z returns to zero.
# A Concrete Example
Let’s trace through exactly how this works with numbers.
Say we’re trading two stocks in the same sector. From historical data, we know the spread (Stock A minus Stock B) has a mean of 50 and a standard deviation of 3.
Day 1: A = $100, B = $50. Spread = 50. Z = 0. No trade.
Day 2: A = $102, B = $50. Spread = 52. Z = 0.67. No trade.
Day 3: A = $105, B = $51. Spread = 54. Z = 1.33. Above +1. ENTER.
- Short A at $105
- Long B at $51
Day 4: A = $107, B = $51. Spread = 56. Z = 2.00.
- Unrealized P&L: -1.9% (A went up, hurting our short)
Day 5-8: A starts falling back, B holds steady.
- Unrealized P&L improves as our thesis plays out
Day 9: A = $100, B = $51. Spread = 49. Z = -0.33. Below zero. EXIT.
- Close short A at $100: profit = (105-100)/105 = 4.76%
- Close long B at $51: profit = (51-51)/51 = 0%
- REALIZED PROFIT = 4.76%
The key distinction: while holding (Days 4-8), we had unrealized gains and losses. The position value fluctuated. We only locked in the profit when we exited on Day 9.
Simulated Trading:
Here’s a visual of the flow:
The blue line tracks the z-score over time. The green shaded region marks where z > +1, our entry zone for
betting the spread will shrink (short A, long B). The red shaded region marks where z < -1, our entry zone for
betting the spread will grow (long A, short B). The dashed line at zero is our exit. Once z crosses back to zero, we close both positions and collect our profit.