
Riding the Wave: A Simple Momentum Strategy
Using moving averages and a median threshold to capture market momentum

Momentum strategy is a common approach to portfolio management, with loads of books behind its complexity.
Today we build a simple momentum strategy using moving averages to gain some intution
What is Momentum?
Momentum is the tendency for recent performance to persist. Winners keep winning. Losers keep losing.
Why does this happen? A few theories:
Slow information diffusion. When good news hits, not everyone reacts immediately. Some investors learn about it days or weeks later. This creates a gradual price adjustment rather than an instant jump.
Herding. When a stock rises, it attracts attention. More buyers pile in. The buying pressure pushes prices higher still. Momentum feeds on itself.
Underreaction: Investors anchor to old prices. When fundamentals improve, they update their expectations slowly. Prices drift upward as reality gradually sinks in.
Whatever the cause, the pattern is real. Our job is to detect it and trade it.
Measuring Momentum with Moving Averages
A simple moving average (SMA) is the average price over the last N periods:
SMAₙ = (Pₜ₋₁ + Pₜ₋₂ + ... + Pₜ₋ₙ) / n
Where:
- Pₜ₋ᵢ = price i periods ago
- n = number of periods (window size)
Short-term SMAs react quickly to price changes. Long-term SMAs smooth out the noise and reveal the underlying trend.
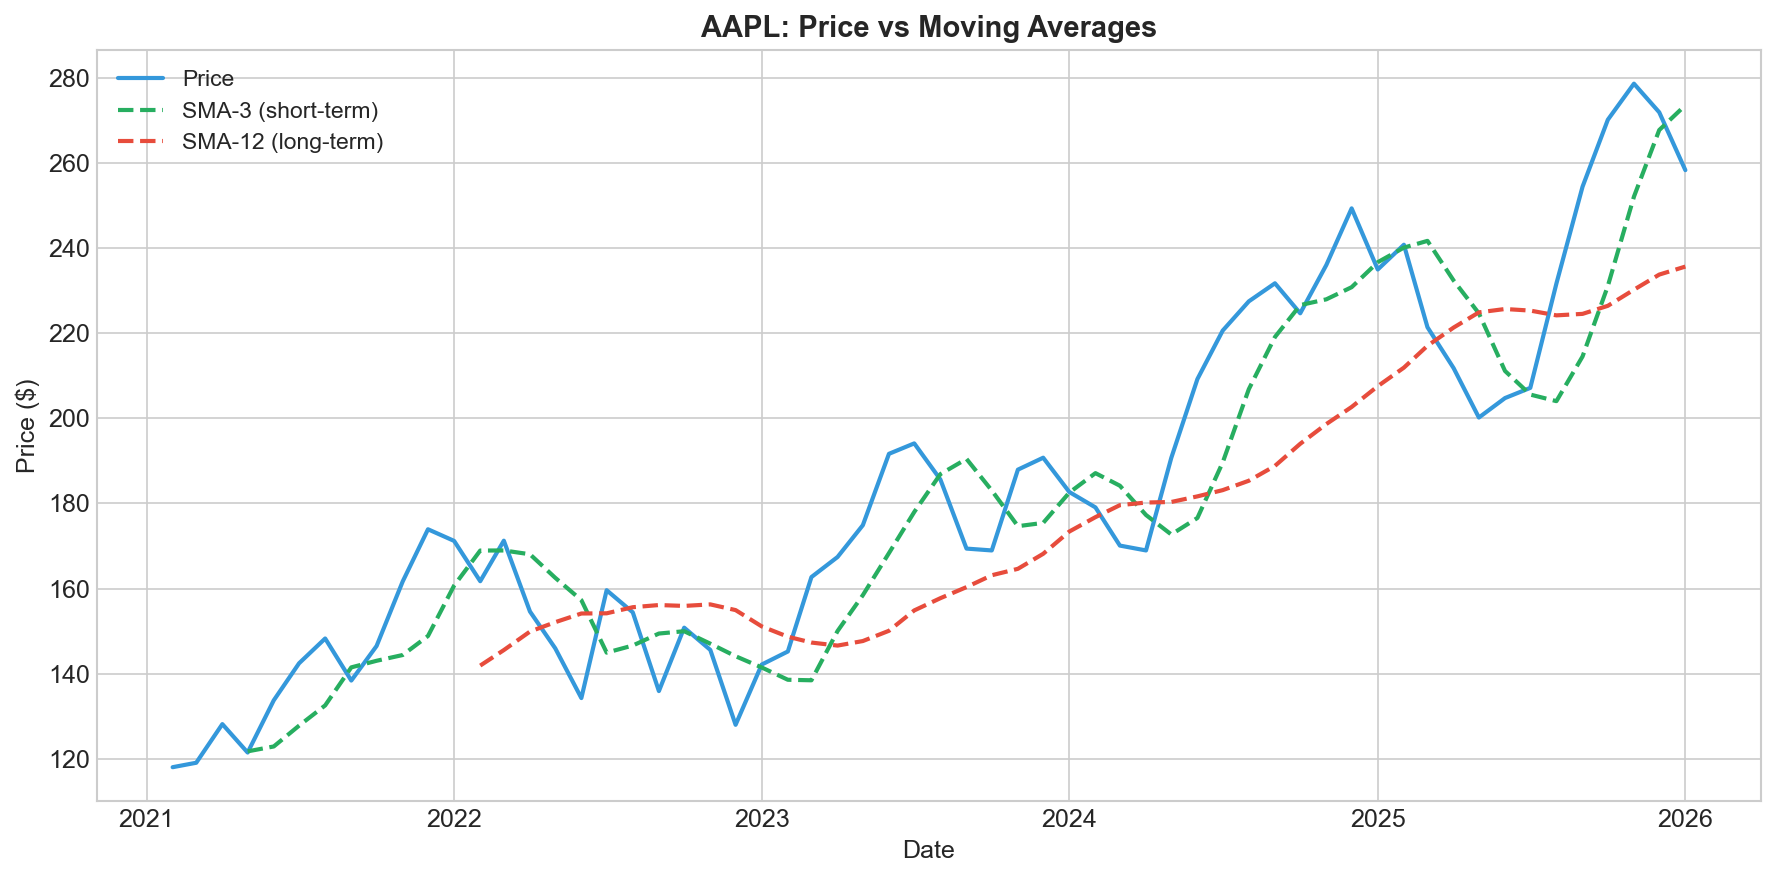
The green line (SMA 3) hugs the price closely and captures recent moves. The red line (SMA 12) is smoother and shows where the stock has been over the past year.
When the short-term average rises above the long-term average, momentum is positive. The stock is trending up. When the short-term average falls below the long-term average, momentum is negative. The stock is trending down.
Building the Momentum Factor
Our momentum factor is simple:
Momentum Factor = SMA₃ − SMA₁₂**
If this number is positive, recent prices are above the long-term trend. Bullish. If negative, recent prices are below the long-term trend. Bearish.
One critical detail: we shift the moving averages by one period. Why? To avoid look-ahead bias.
When you sit at your desk on January 31st deciding whether to buy, you do not know January’s closing price yet. You only know data through December. The shift ensures our signal uses only information that was actually available at decision time.
The Median Threshold
Now we need to convert our momentum factor into a trading signal. We use the median.
**Signal Logic:**
- If Factor > Median → Go Long (+1)
- If Factor < Median → Go Short (−1)
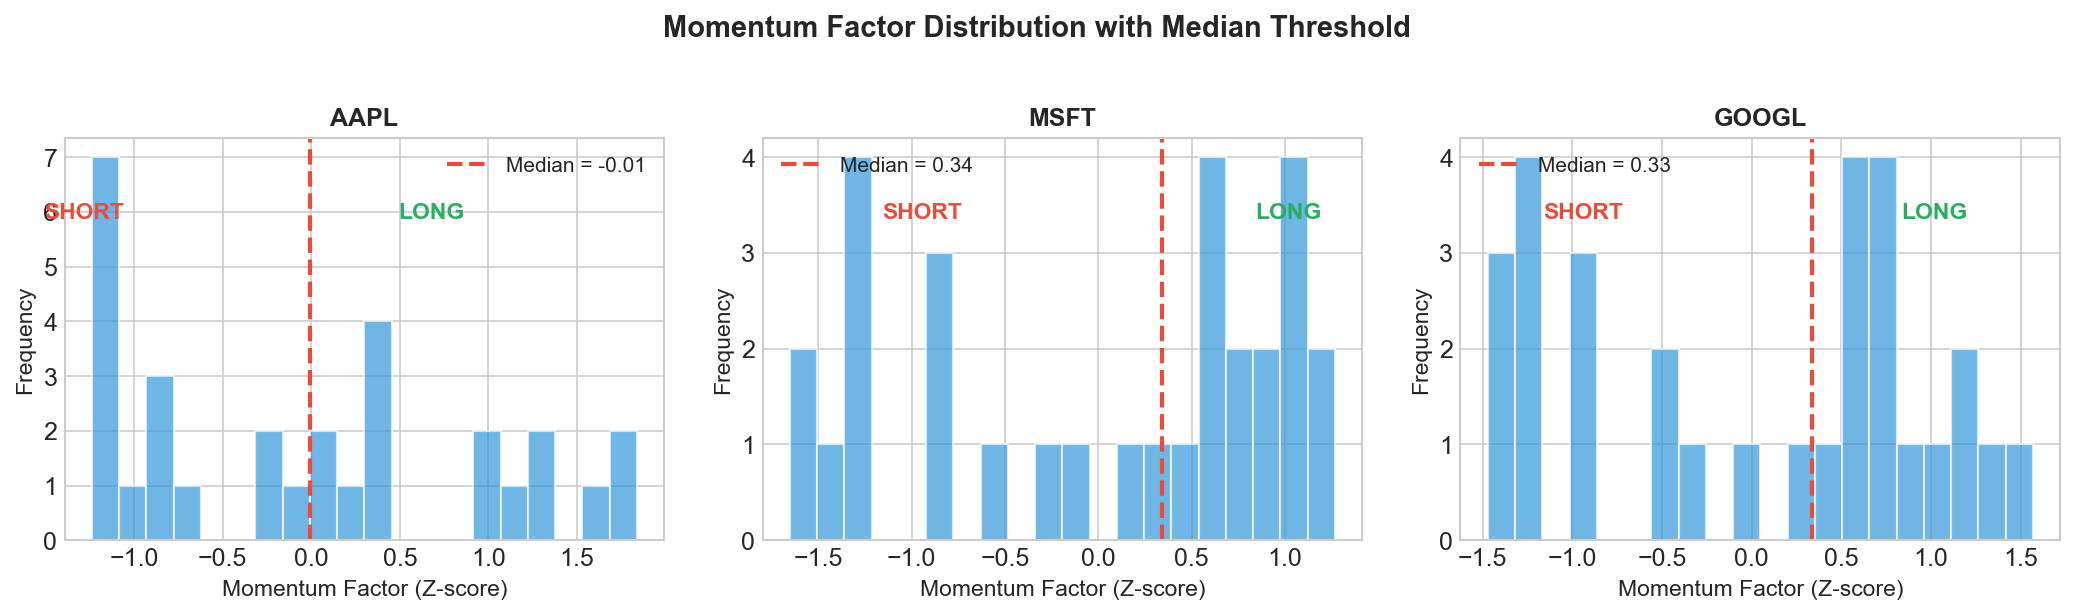
The red dashed line marks the median. Everything to the right gets a long signal. Everything to the left gets a short signal.
No look-ahead bias here either. We calculate the median using only training data (the first 70% of our sample), then apply that fixed threshold to the test data (the remaining 30%). We never peek at future information.
Putting It Together
The full strategy works like this:
1. Calculate moving averages (SMA 3 and SMA 12), shifted by one period
2. Compute momentum factor (SMA₃ − SMA₁₂)
3. Normalize using z-scores from training data
4. Generate signal based on median threshold from training data
5. Calculate profit as signal × next month’s return
That last step deserves explanation. We see the momentum signal at the end of month T. We trade at the start of month T+1. We earn month T+1’s return. So profit equals last month’s signal multiplied by this month’s return.
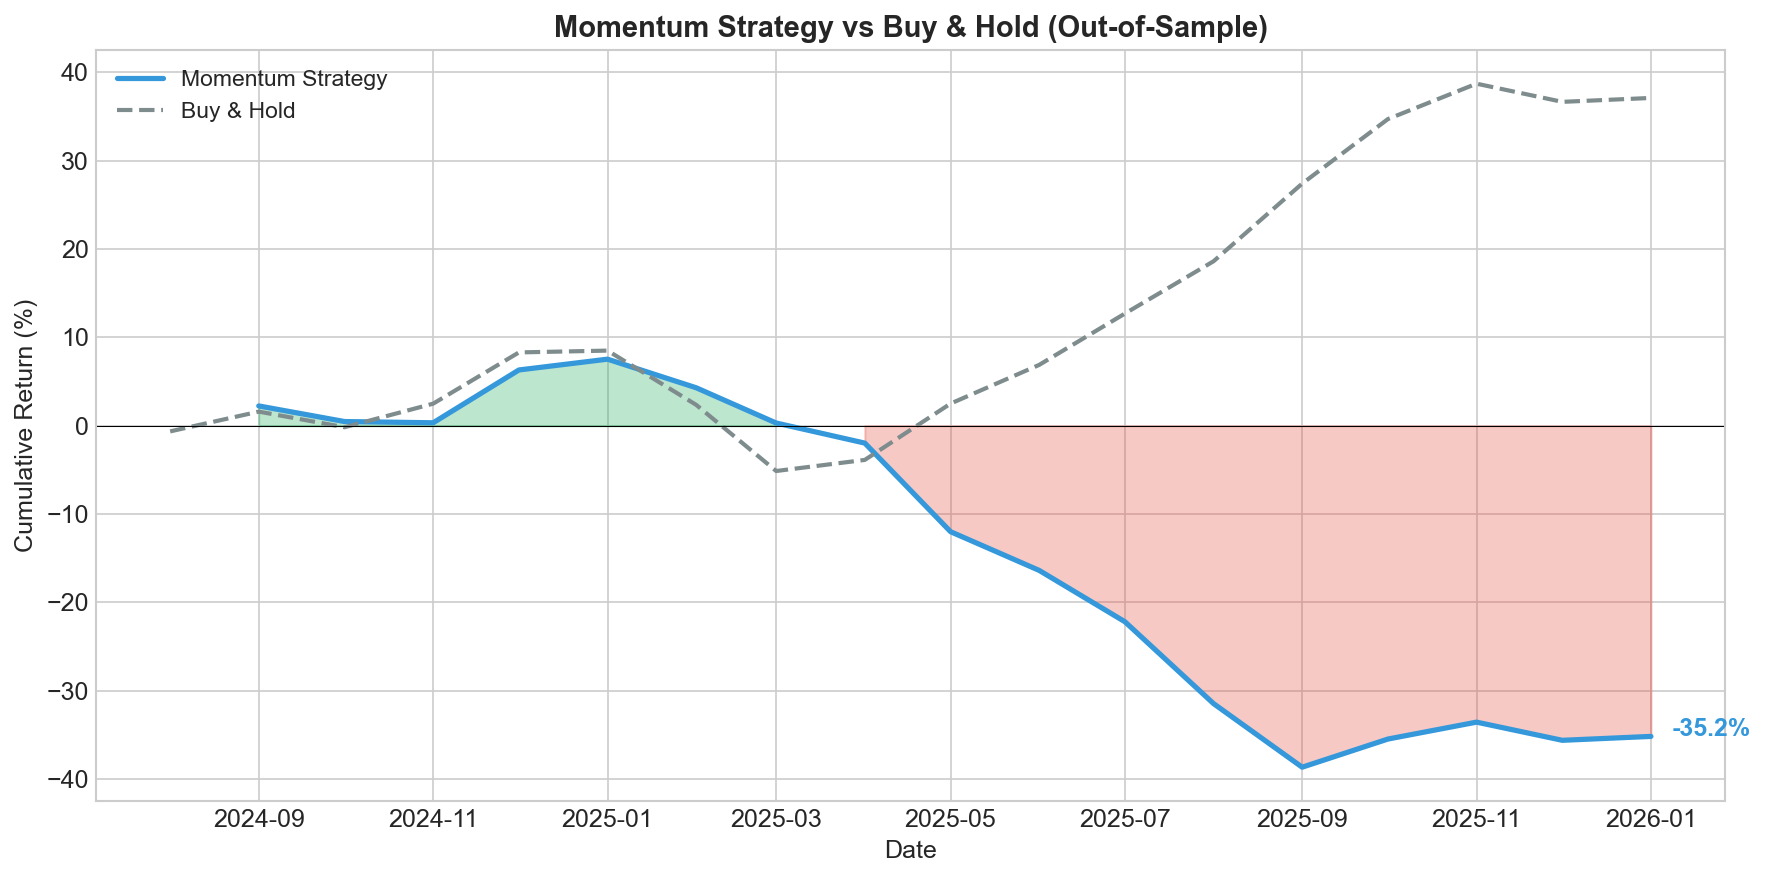
The blue line shows our momentum strategy’s cumulative return on out-of-sample data. The gray dashed line shows a simple buy-and-hold benchmark.
What Can Go Wrong
This is a toy example, not investment advice. A few caveats:
Transaction costs. We trade monthly. Each trade has costs: commissions, bid-ask spreads, market impact. These add up. A strategy that looks great on paper can turn negative after costs.
Momentum crashes. Momentum works until it does not. When markets reverse sharply (like March 2009), momentum strategies get crushed. They hold yesterday’s winners, which become today’s biggest losers.
Overfitting. We picked 3-month and 12-month windows. Why not 2 and 10? Or 4 and 15? With enough parameter combinations, you can find something that worked in the past purely by chance. Out-of-sample testing helps, but is not foolproof.
Crowding. Momentum is well known. When everyone runs the same strategy, the edge gets arbitraged away. Signals become self-defeating.