
The Quant’s Vocabulary: Alpha, Beta, and Friends
Essential metrics every portfolio investor needs to know

When you’re evaluating investments, you’ll hear terms like alpha, beta, and volatility thrown around constantly. Fund managers brag about their alpha. Analysts warn about high-beta stocks. But what do these actually mean? Let’s break them down.
Returns & Noise
At its core, a return is just the percentage change in price:
Rₜ = (Pₜ − Pₜ₋₁) / Pₜ₋₁**
Where Pₜ is today’s price and Pₜ₋₁ is yesterday’s price. If a stock goes from $100 to $102, that’s a 2% return. Simple enough.
The key insight here is that returns have two components: **signal** (the expected return) and **noise** (random fluctuations). When we look at daily stock returns, most of what we see is noise. The signal is buried in there somewhere, but extracting it is the whole game.
Volatility
Volatility measures how much returns bounce around. It’s the standard deviation of returns:
σ = √[ Σ(Rᵢ − R̄)² / n ]**
Where:
- σ = volatility (standard deviation)
- Rᵢ = return on day i
- R̄ = mean return
- n = number of observations
A stock with 30% annual volatility will have wilder swings than one with 10% volatility.
We typically annualize daily volatility:
**σ_annual= σ_daily × √252**
Why √252? Because variance scales linearly with time, but standard deviation scales with the square root. There are 252 trading days in a year.
ₐ
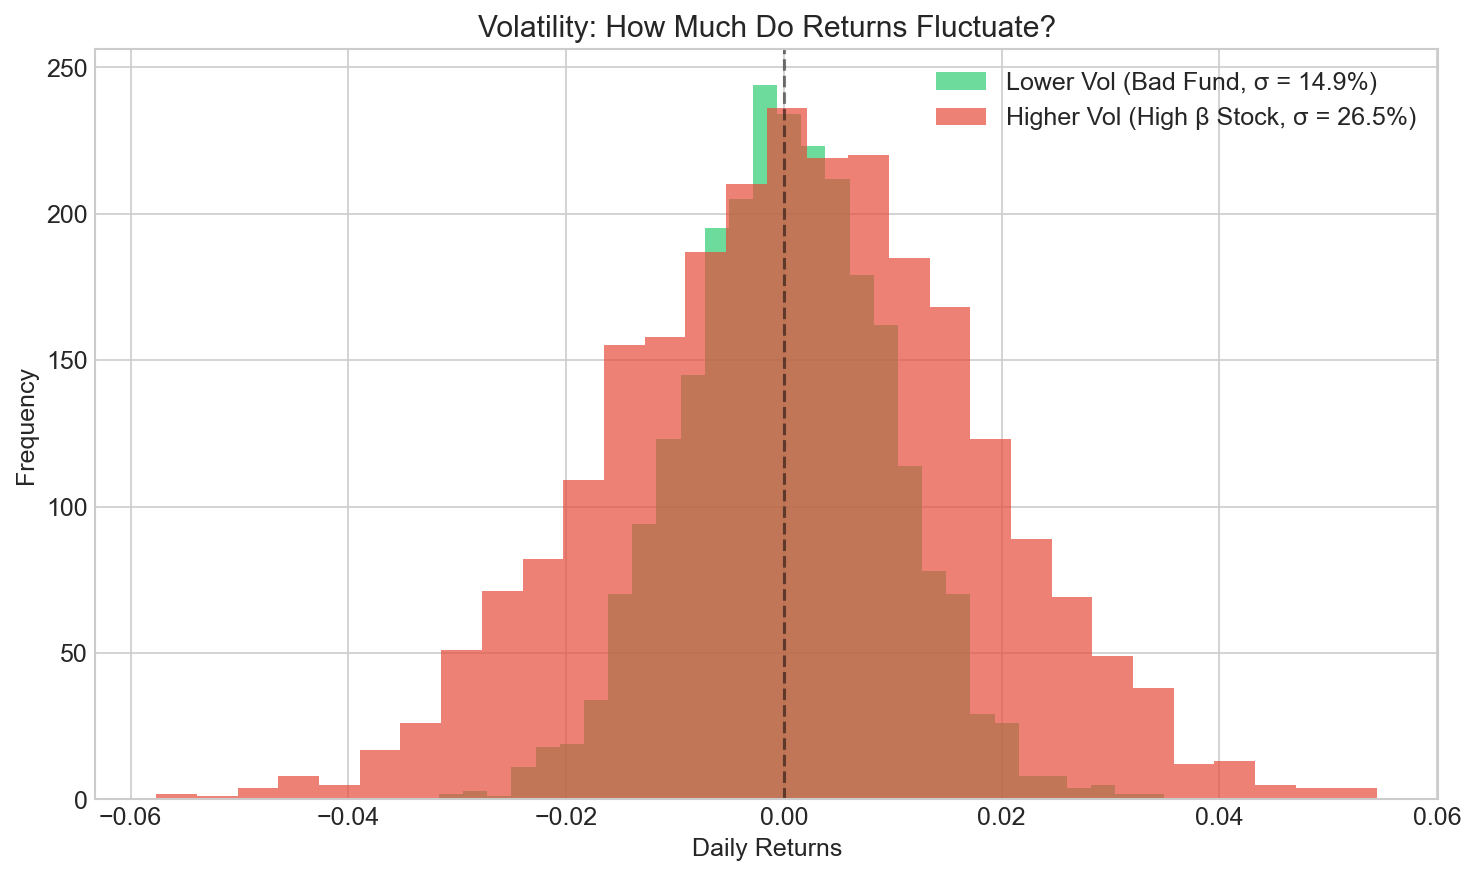
Notice how the high-vol stock (red) has returns spread across a much wider range. More uncertainty, more risk. The low-vol fund (green) clusters tightly around zero.
Higher volatility means more uncertainty. If you’re saving for a house next year, a high-vol stock might keep you up at night. For a retirement account 30 years out? You can probably stomach the swings.
Beta
Beta tells you how much a stock moves relative to the market:
β = Cov(Rᵢ, Rₘ) / Var(Rₘ)**
Where:
- β = beta
- Cov(Rᵢ, Rₘ) = covariance between stock and market returns
- Var(Rₘ) = variance of market returns
It’s the slope of the regression line when you plot stock returns against market returns.
**β = 1** means the stock moves with the market.
**β > 1** means the stock amplifies market moves (up more on good days, down more on bad days).
**β < 1** means the stock dampens market moves.
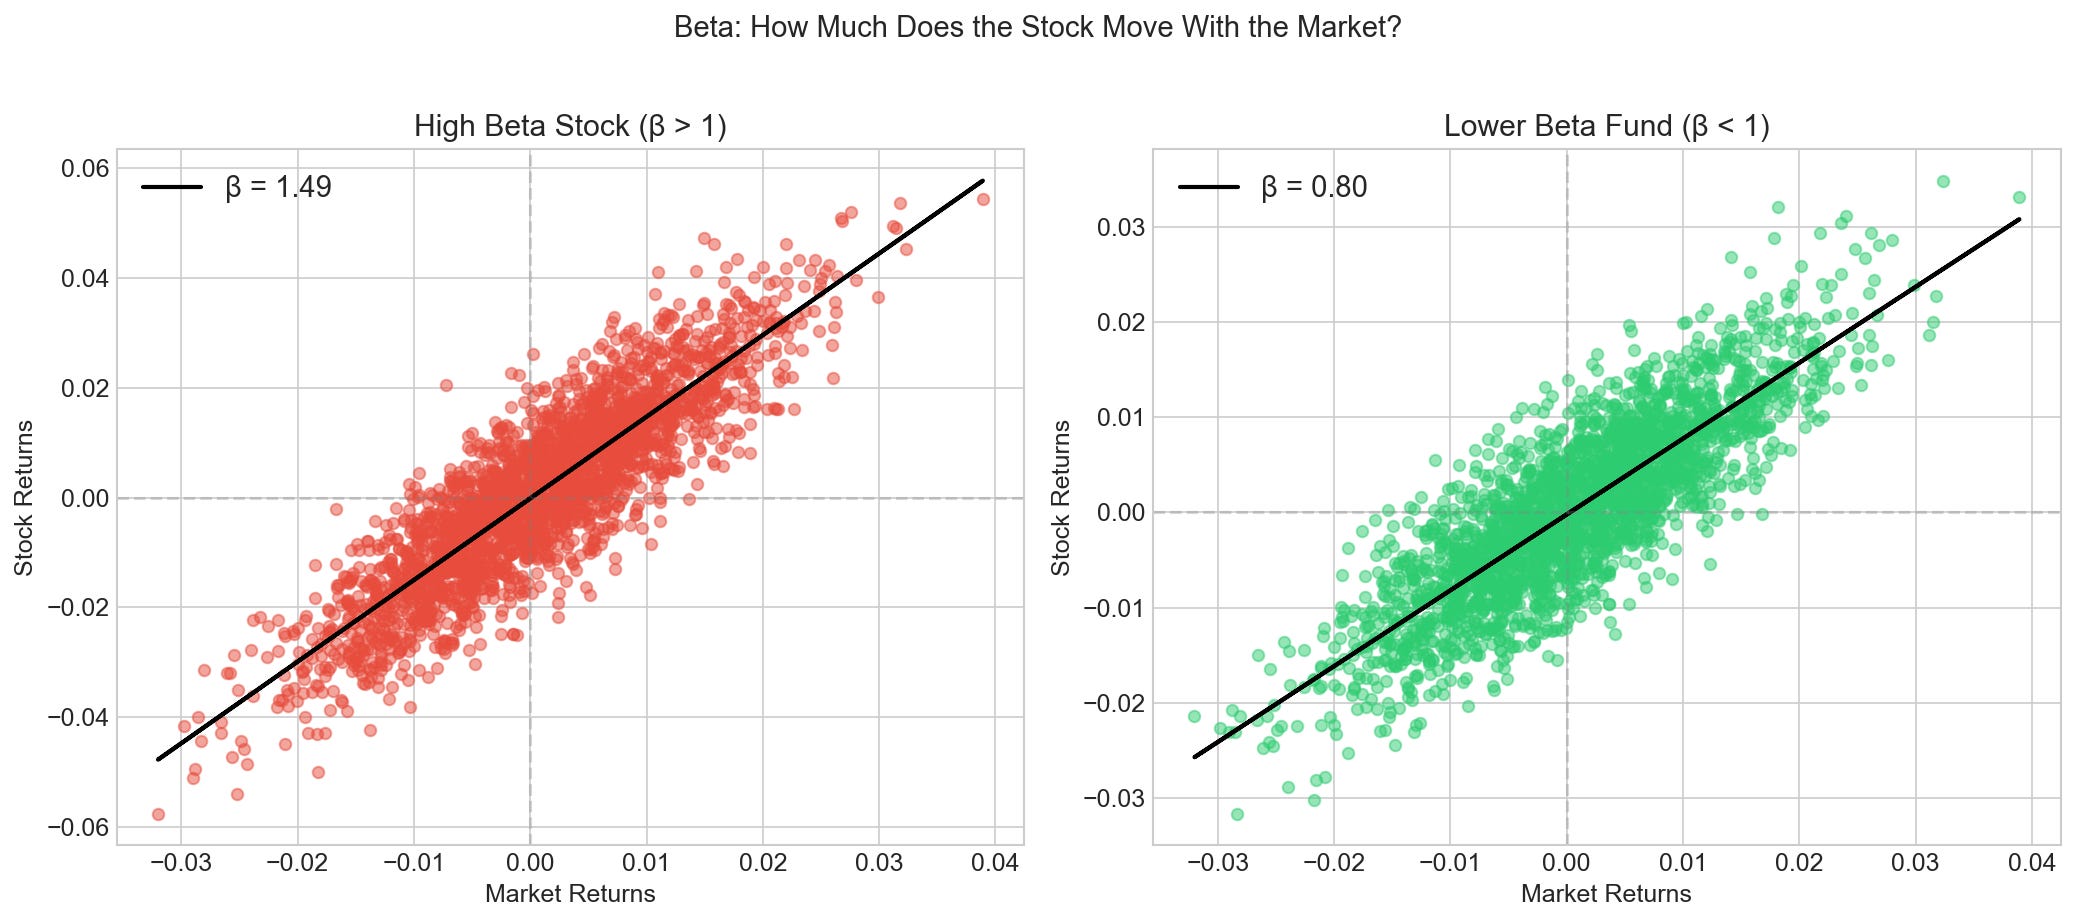
Look at the slopes. The high-beta stock (around 1.5) moves 1.5x the market. When the market is up 1%, this stock tends to be up 1.5%. The lower-beta fund (around 0.8) has a flatter slope—it doesn’t swing as hard.
Tech stocks tend to have high betas. Utilities tend to have low betas. This isn’t good or bad—it depends on what you’re trying to achieve.
## Alpha
Alpha is the holy grail. It’s the excess return beyond what beta would predict.
The logic comes from CAPM (Capital Asset Pricing Model), which says your expected return should be:
**E(Rᵢ) = Rꜰ + βᵢ × (Rₘ − Rꜰ)**
Where:
- E(Rᵢ) = expected return of asset i
- Rꜰ = risk-free rate (Treasury bills, ~5%)
- βᵢ = beta of asset i
- Rₘ = market return
- (Rₘ − Rꜰ) = market risk premium
Alpha is the difference between actual and expected return:
**α = Rᵢ − E(Rᵢ)**
**α = Rᵢ − [Rꜰ + β × (Rₘ − Rꜰ)]**
If CAPM says you should earn 10% given your beta, but you earned 12%, that 2% is your alpha. It’s the “skill” component—the value added beyond just riding the market.
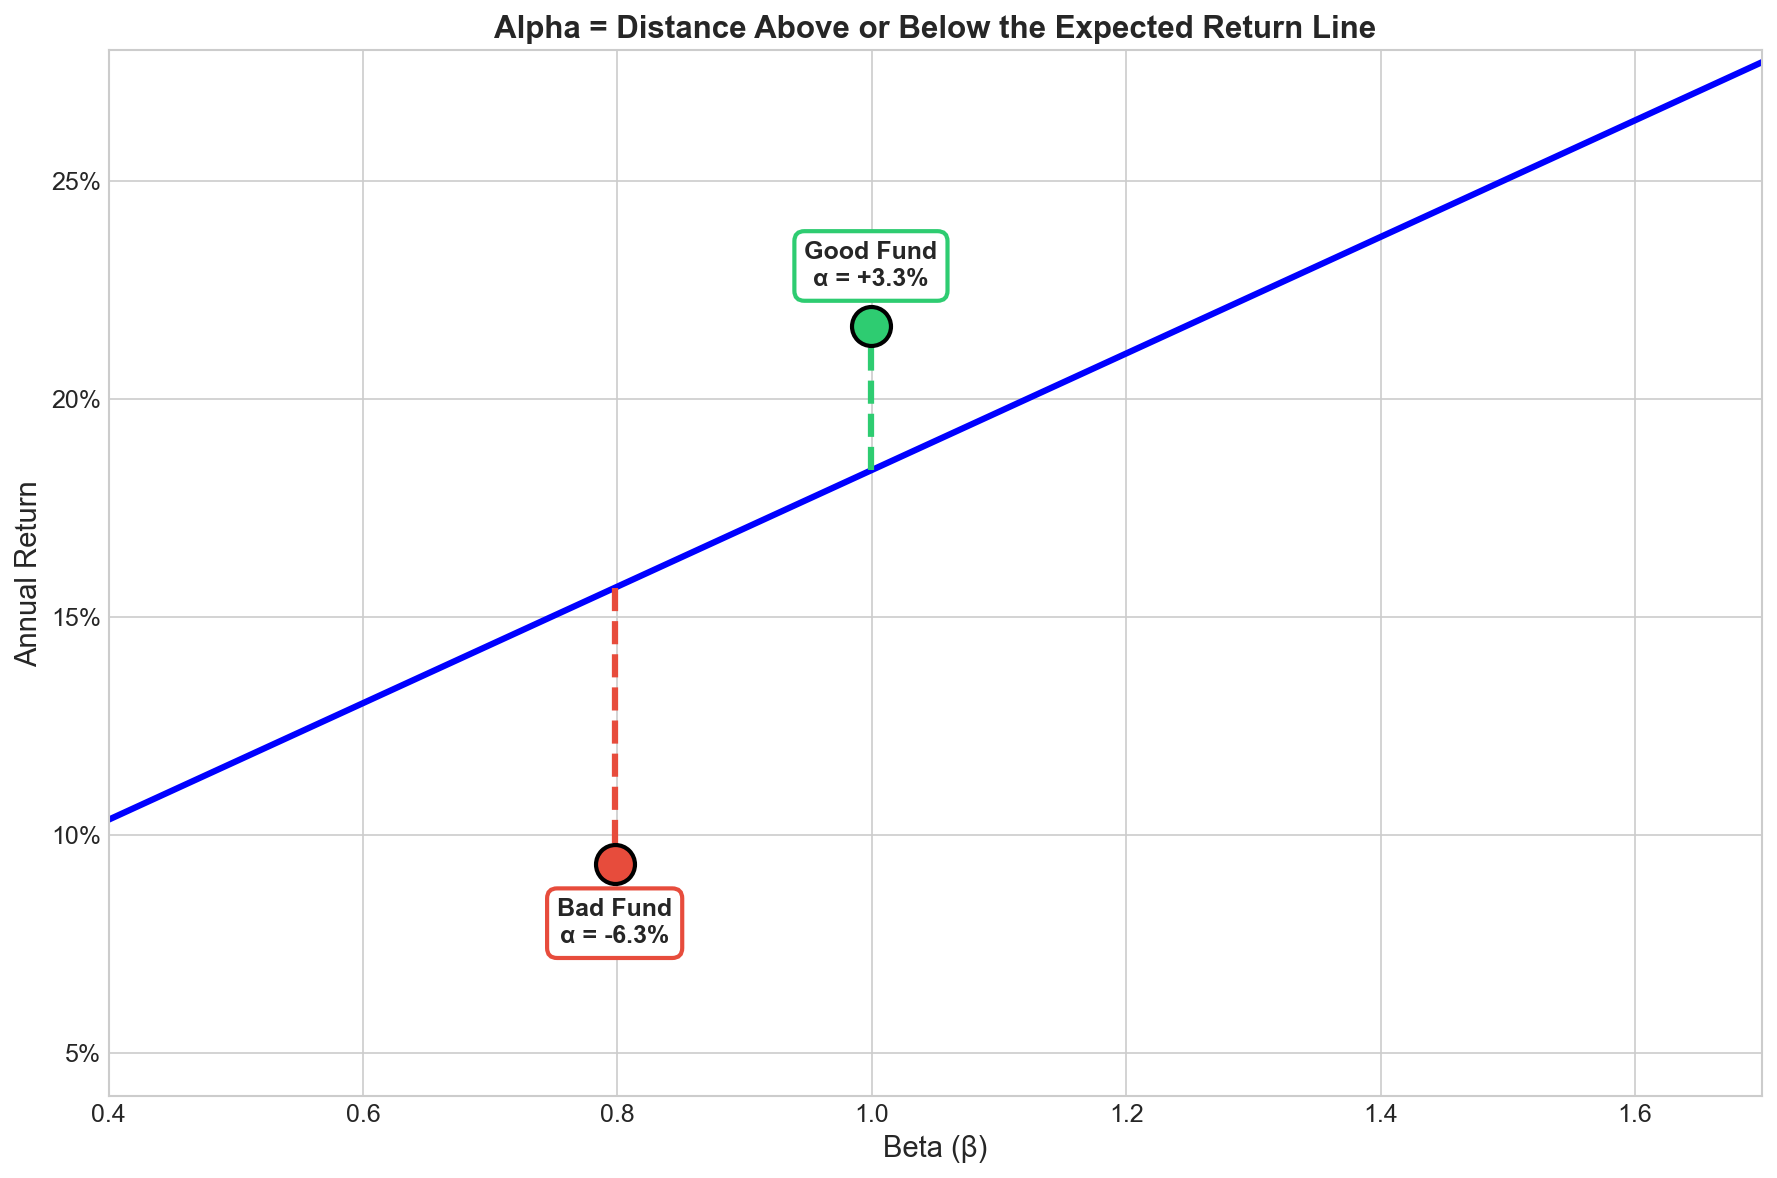
The blue diagonal line shows where you SHOULD be based on your beta. The colored dots show where each fund ACTUALLY landed. The dashed lines show the alpha—the gap between expected and actual.
The Good Fund (green) sits above the line with positive alpha—it’s beating expectations. The Bad Fund (red) sits below the line with negative alpha—it’s destroying value. The High Beta Stock (blue) is roughly on the line—no skill, just market exposure.
Reality check on alpha
Most actively managed funds have α ≈ 0% or negative after fees. Consistent α of +2% annually is exceptional (top 10% of managers). Warren Buffett’s lifetime α is estimated at 4-6%—that’s GOAT territory.
Index funds are often used as baselines as why pay managers that deliver poor alpha?
Correlation
Correlation measures how two assets move together, ranging from -1 to +1:
ρ(X,Y) = Cov(X,Y) / (σₓ × σᵧ)**
Where:
- ρ = correlation coefficient
- Cov(X,Y) = covariance between X and Y
- σₓ, σᵧ = standard deviations of X and Y
It’s covariance normalized to always fall between -1 and +1.
**ρ = +1** means perfect positive correlation (move together exactly).
**ρ = 0** means no correlation (independent movements).
**ρ = −1** means perfect negative correlation (move exactly opposite).
Tech A and Tech B are highly correlated (0.87)—makes sense, they’re in the same sector. Bonds are negatively correlated with the market (−0.80)—when stocks tank, investors flee to bonds. Gold just does its own thing (near zero correlation with everything).
This is why diversification works. If all your assets move together, you’re not actually diversified. Mix in some uncorrelated or negatively correlated assets and your portfolio’s overall volatility drops. Summary
Volatility (σ)
Formula: σ = std(R)
What it tells you: How risky the asset is (how much returns fluctuate)
Beta (β)
Formula: β = Cov(Rᵢ, Rₘ) / Var(Rₘ)
What it tells you: How the asset moves relative to the market
Alpha (α)
Formula: α = Rᵢ − [Rꜰ + β(Rₘ − Rꜰ)]
What it tells you: Excess return beyond what beta predicts
Correlation (ρ)
Formula: ρ = Cov(X, Y) / (σₓ × σᵧ)
What it tells you: How two assets move together
When evaluating an investment, you want to know: What’s the expected return? What’s the risk? And how does this fit with what I already own?